PayPal Developer Portal & AI Authorization
From 45k to 135k monthly developers — and +$1M merchant revenue
Problem
PayPal's developer portal was the front door for integrators, but discovery, onboarding, and tool adoption were fragmented. Developers churned during integration; merchants in the US and EU were losing revenue to declined authorizations they couldn't diagnose or fix.
Research
Before a single pixel moved, we ran 30+ developer interviews, a competitive teardown of Adyen, Square, and Stripe, and a diary study with SMB merchants. The data made the brief: developers trusted PayPal the brand but distrusted the portal — and that gap was costing merchants real revenue.
Where the old portal lost developers
Where PayPal still won
Who set the bar — and where
Two themes ran through every interview
Developers measured us in time-to-first-API-call, error rates, and how fast we shipped fixes. Anything that slowed them down — including the portal itself — was a tax on our reputation.
Developers weren't just implementers — they were the ones recommending payments providers to SMB founders. Earning their trust was earning the merchant.
Seven measurable goals
- 01−35%Time-to-market for new integrations
- 022×Testing-tool adoption per developer
- 033×Monthly portal traffic
- 04+30%Developer tool usage per quarter
- 05−62%Developer integration errors
- 06+$1MMerchant authorization revenue lift
- 07AAWCAG compliance across portal surfaces
Two journeys. One map.
- ·Compare providers
- ·Evaluate docs
- ·Match developer
- ·Create app
- ·Get keys
- ·Scope project
- ·Sandbox tests
- ·First call
- ·Webhook setup
- ·Go live
- ·Monitor
- ·Diagnose
Four How-Might-We bets
How might we match SMBs with the right developer at the right moment?
How might we make integration complexity visible up front?
How might we let merchants explore checkout visually before they commit?
How might we give developers a scoping tool their PMs trust?
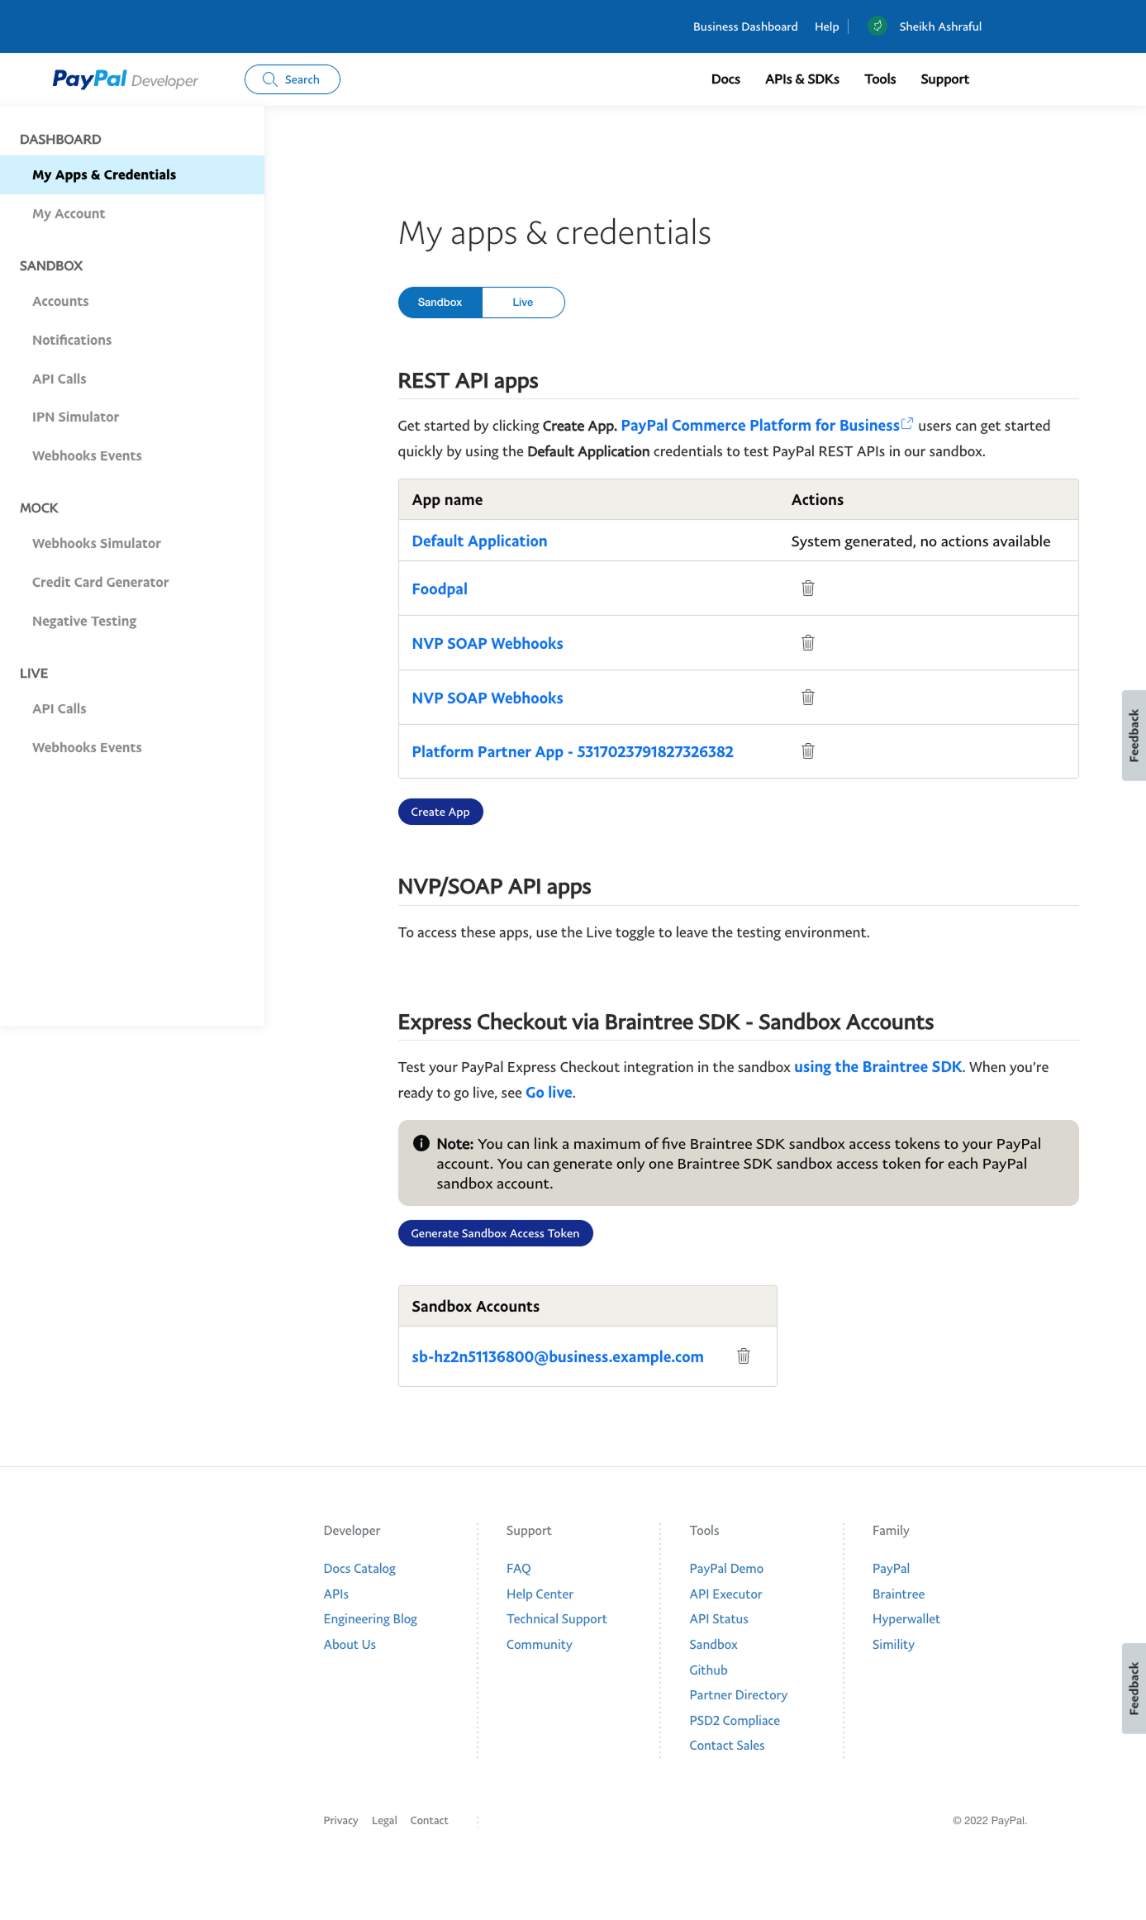
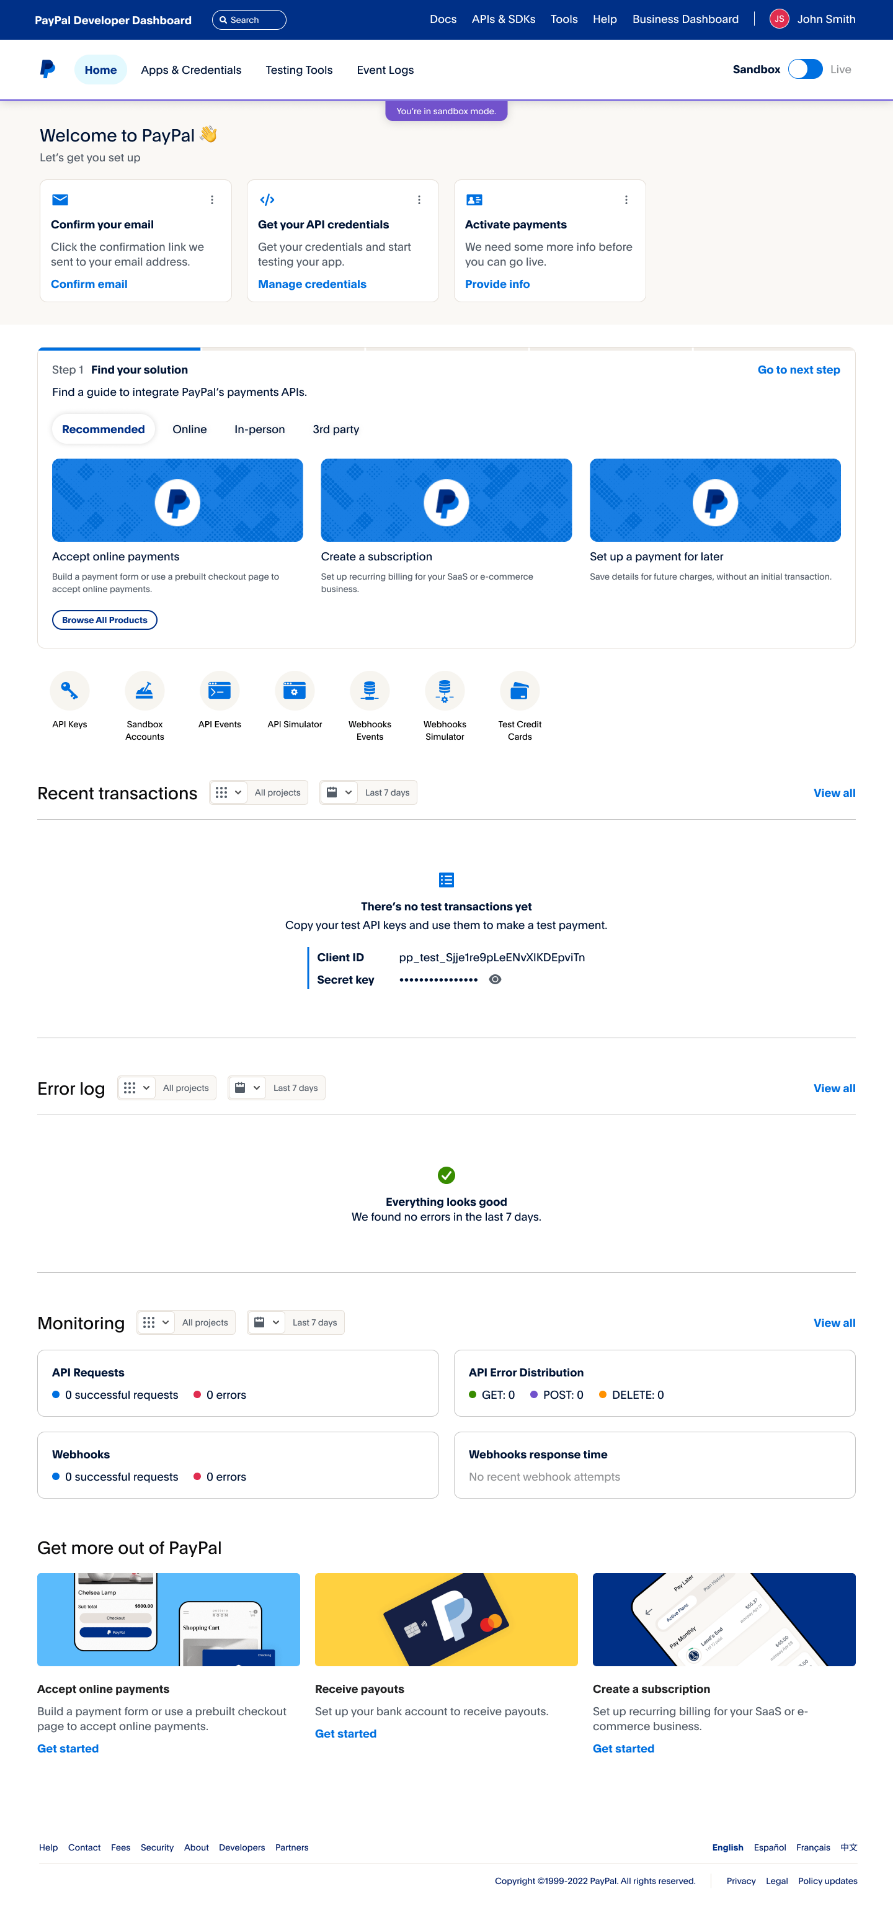
Landing → Dashboard. The old apps & credentials page asked developers to read marketing copy before getting to keys. The redesign opens with a personalized welcome, recent transactions, error logs, and monitoring — the four things developers actually return for.
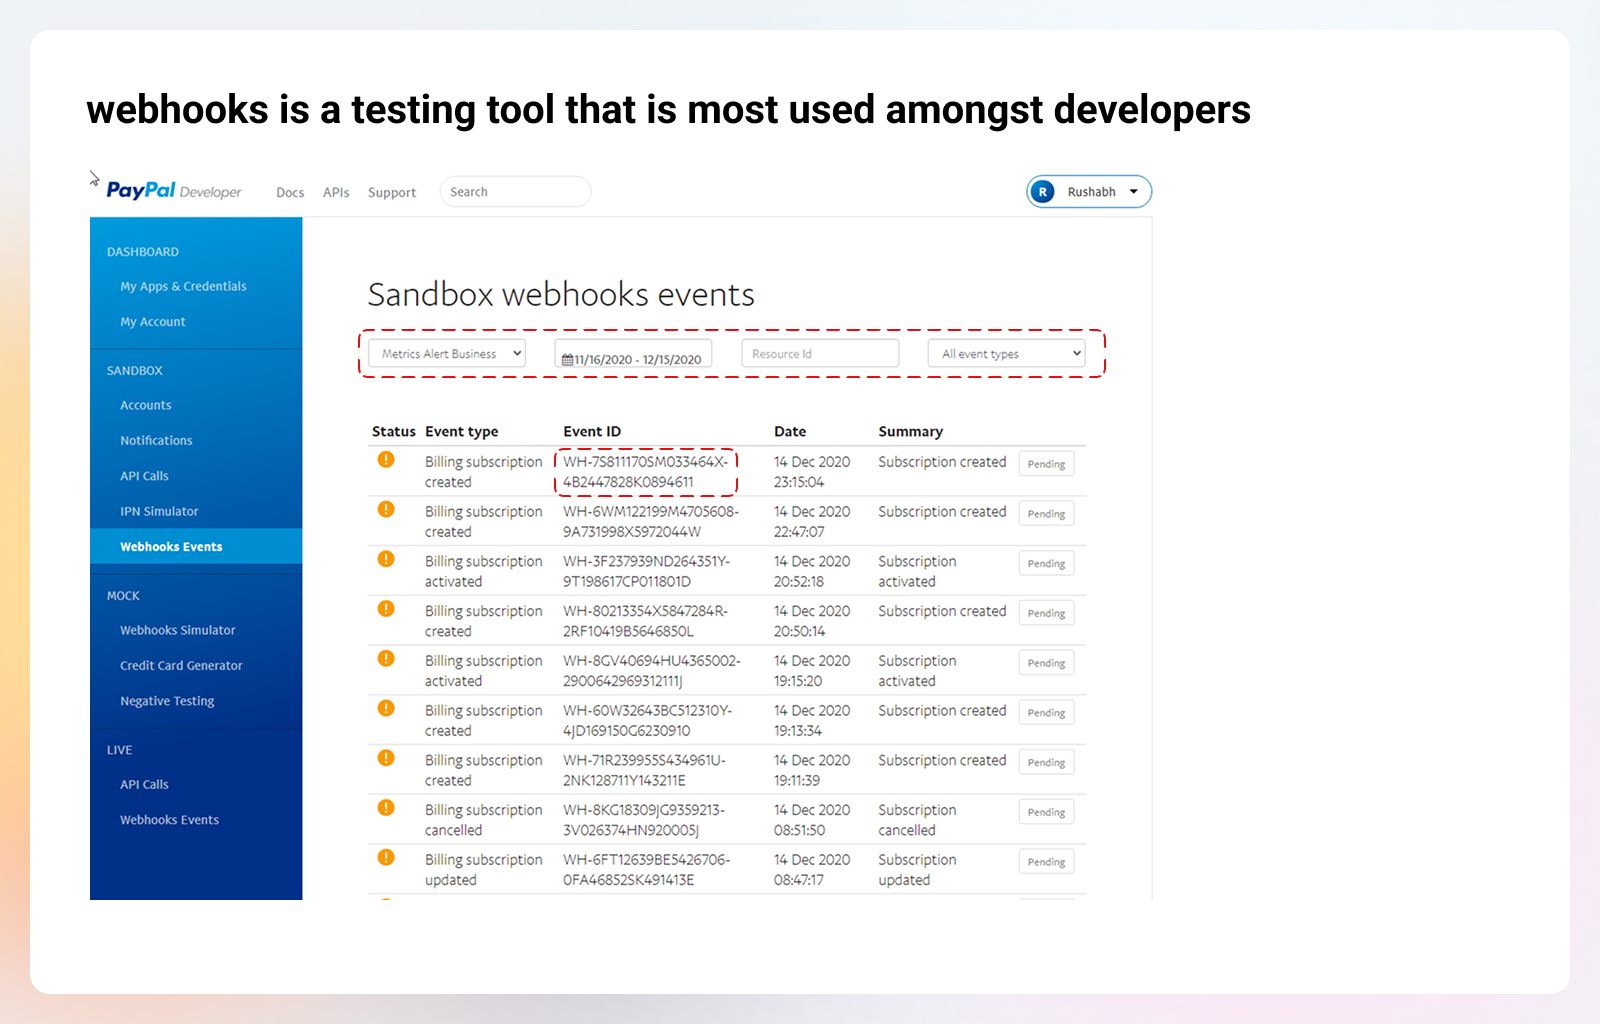
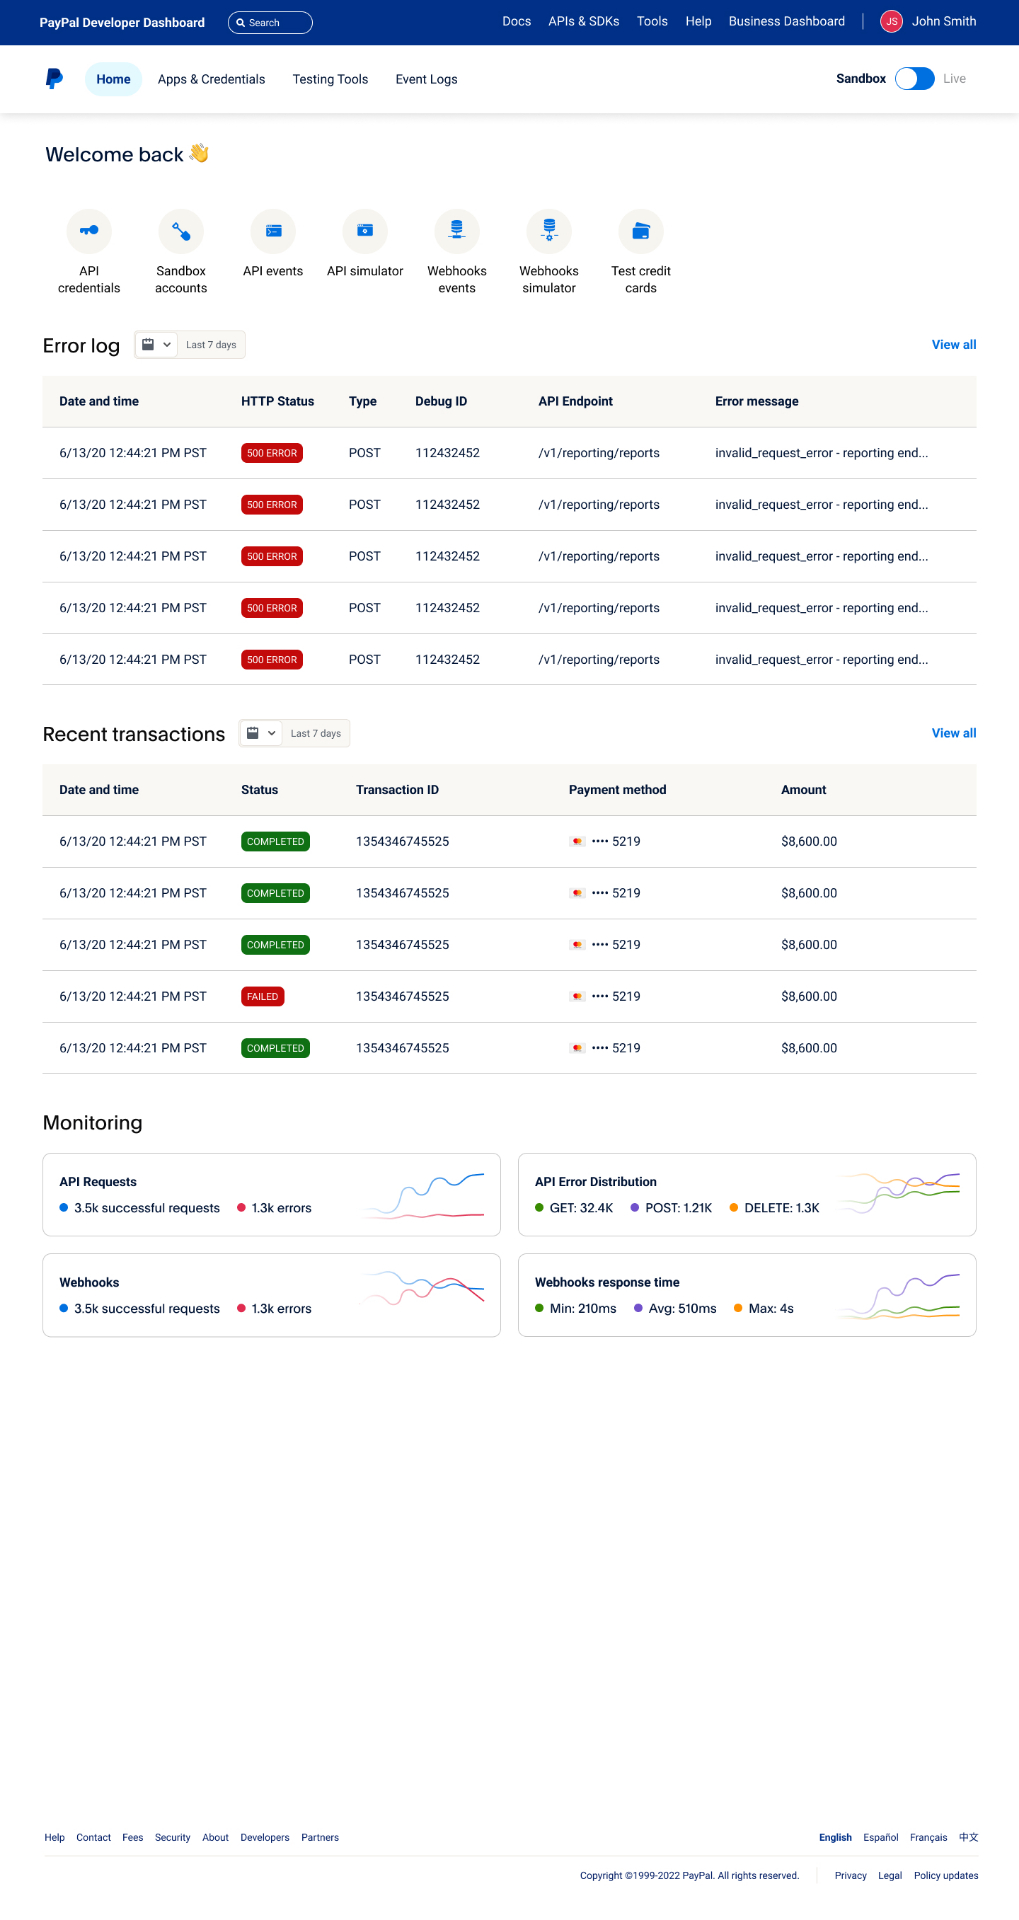
Webhooks events, before & after. The legacy table buried failures inside dense sidebar navigation. The new design surfaces status, response time, and a resend action in one row — and 37% more developers used the tool within a quarter.
Process
Developer journey mapping
Mapped merchant authorization workflows end-to-end, identified friction points in onboarding, and built empathy maps and personas to align product, research, and engineering on the highest-leverage developer moments.
Portal redesign + guided walkthrough
Streamlined the developer portal IA and built an in-product walkthrough so developers could learn and try new features without leaving context. Shipped in 4 months — traffic grew from 45,000 to 135,000 monthly visits.
AI authorization tool
Designed an AI-driven tool that surfaces why a transaction was declined and how to fix it — improving merchant authorization rates and lifting revenue by $1M for US and EU merchants. Led the AI chat app that cut payment processing time by 14% and added $230k in revenue.
Tooling adoption
Iterated on developer tools with usability testing and analytics — usage rose 30% in a single quarter while developer-side errors dropped 62%.
Outcomes
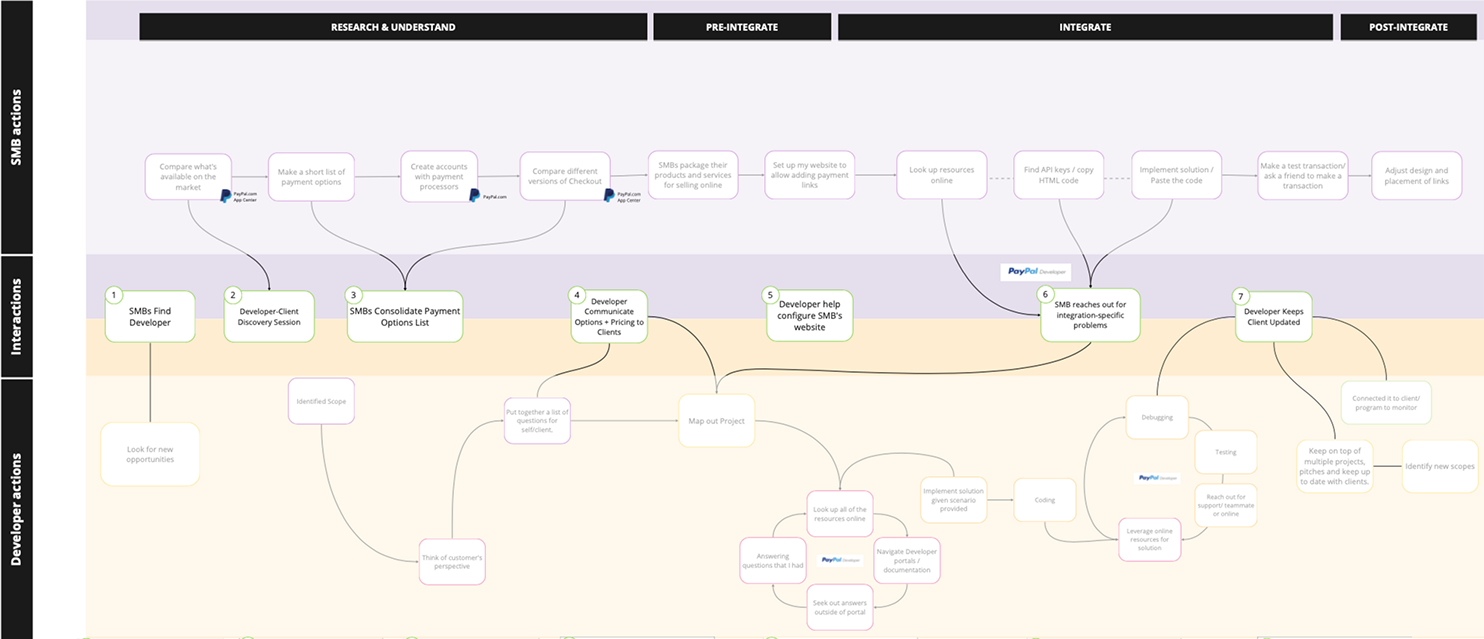
Mapping two journeys at once
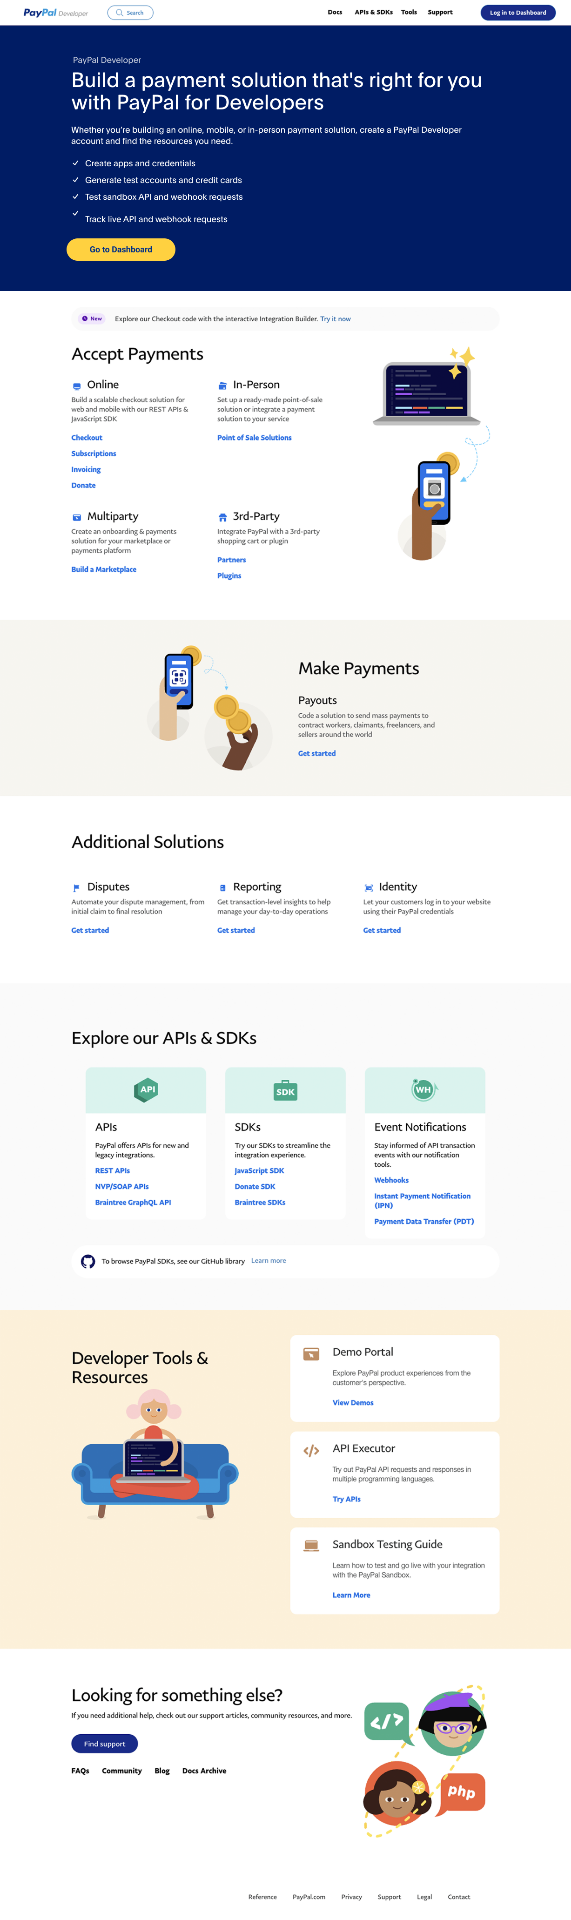
Where developers used to land
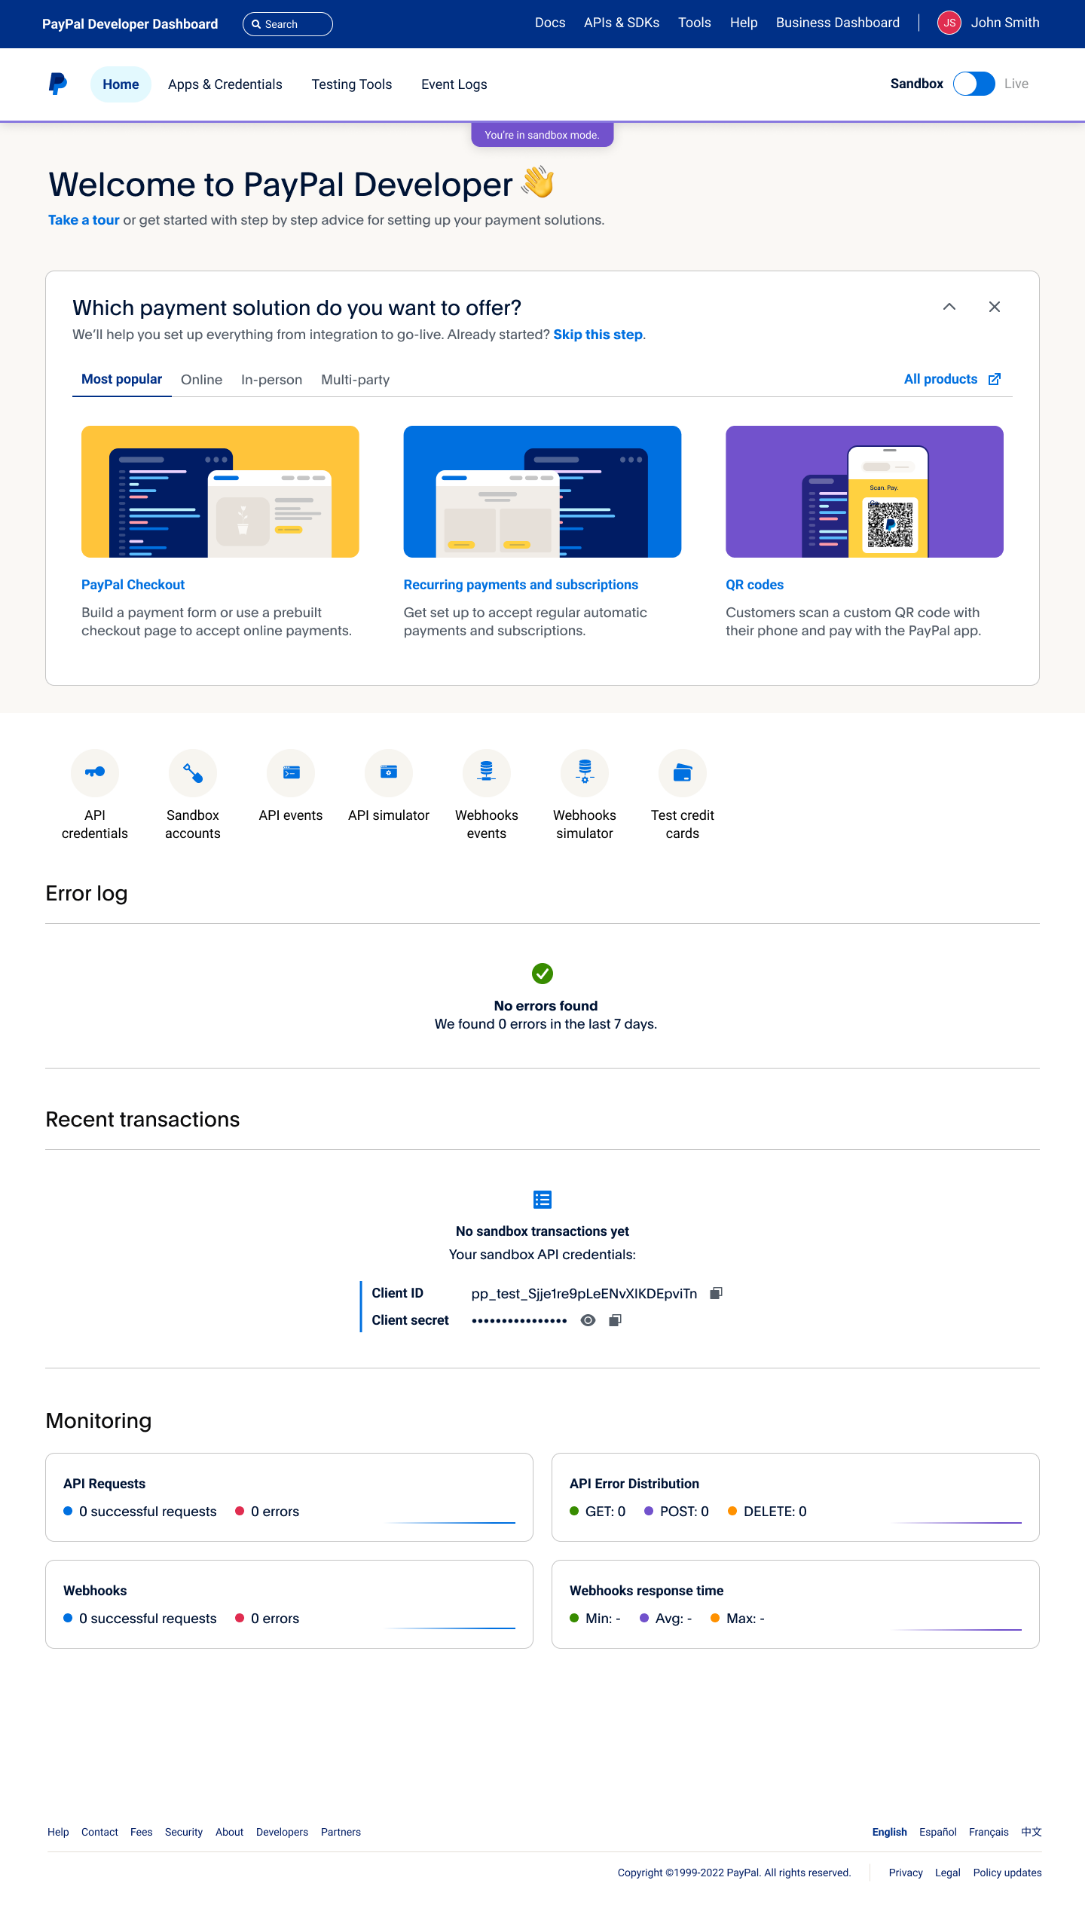
A welcome that does the work
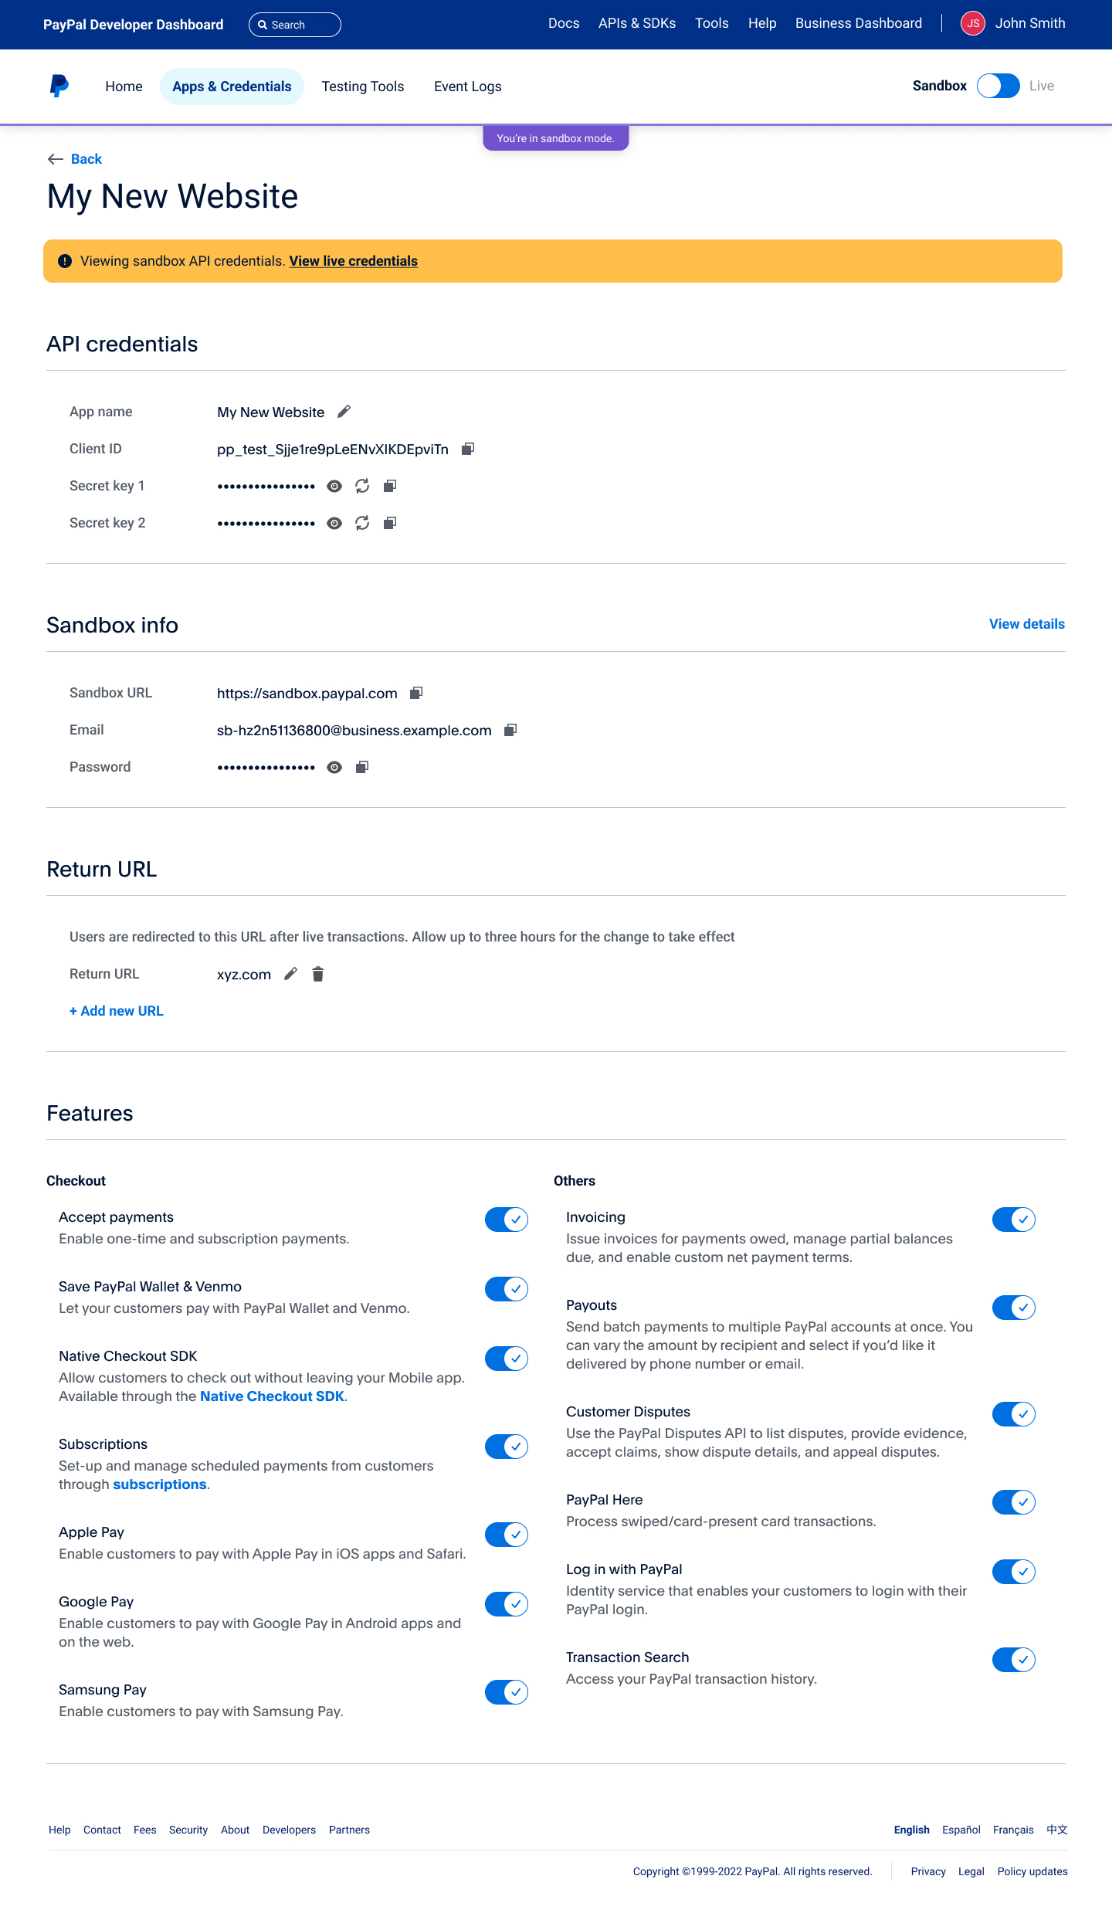
Credentials, demystified
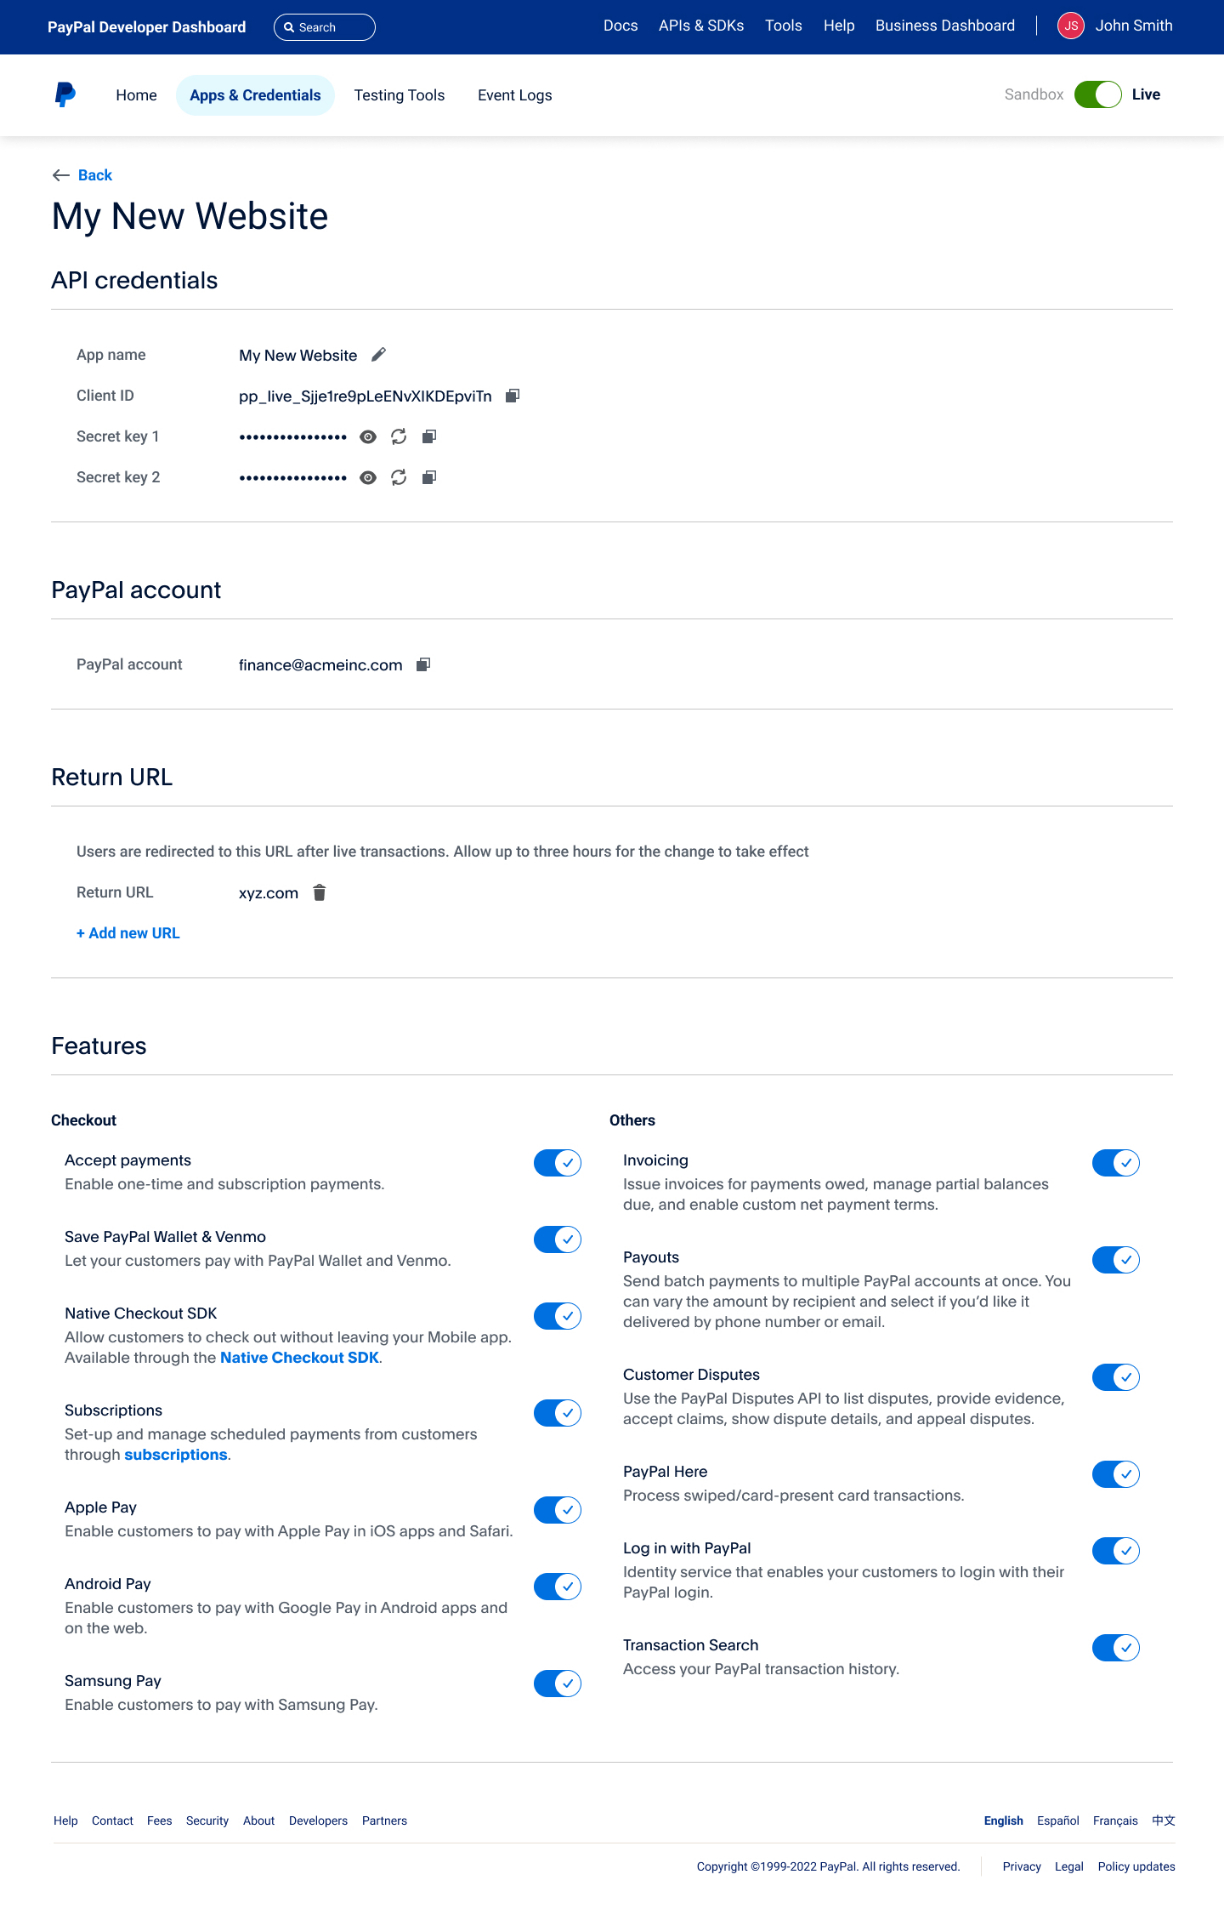
From sandbox to production
Errors, surfaced not buried
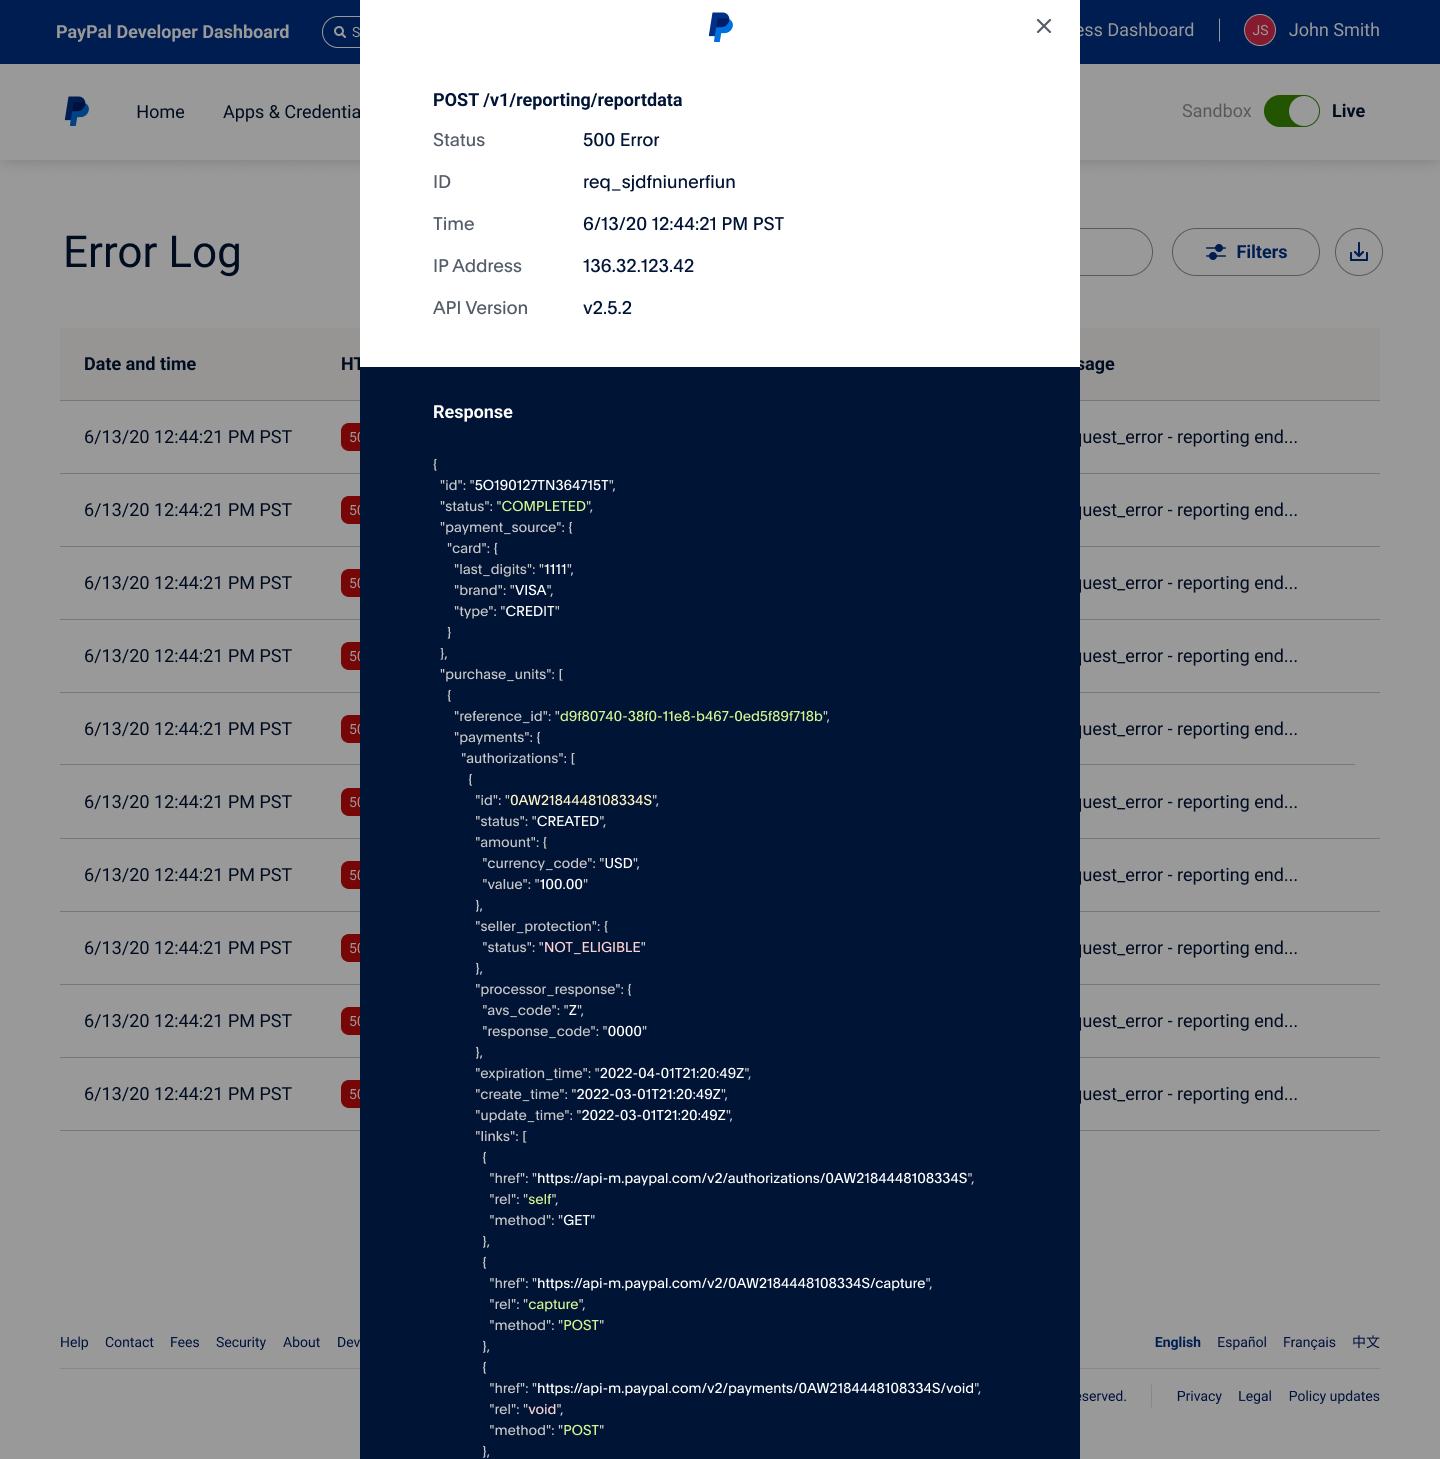
AI explains the 500
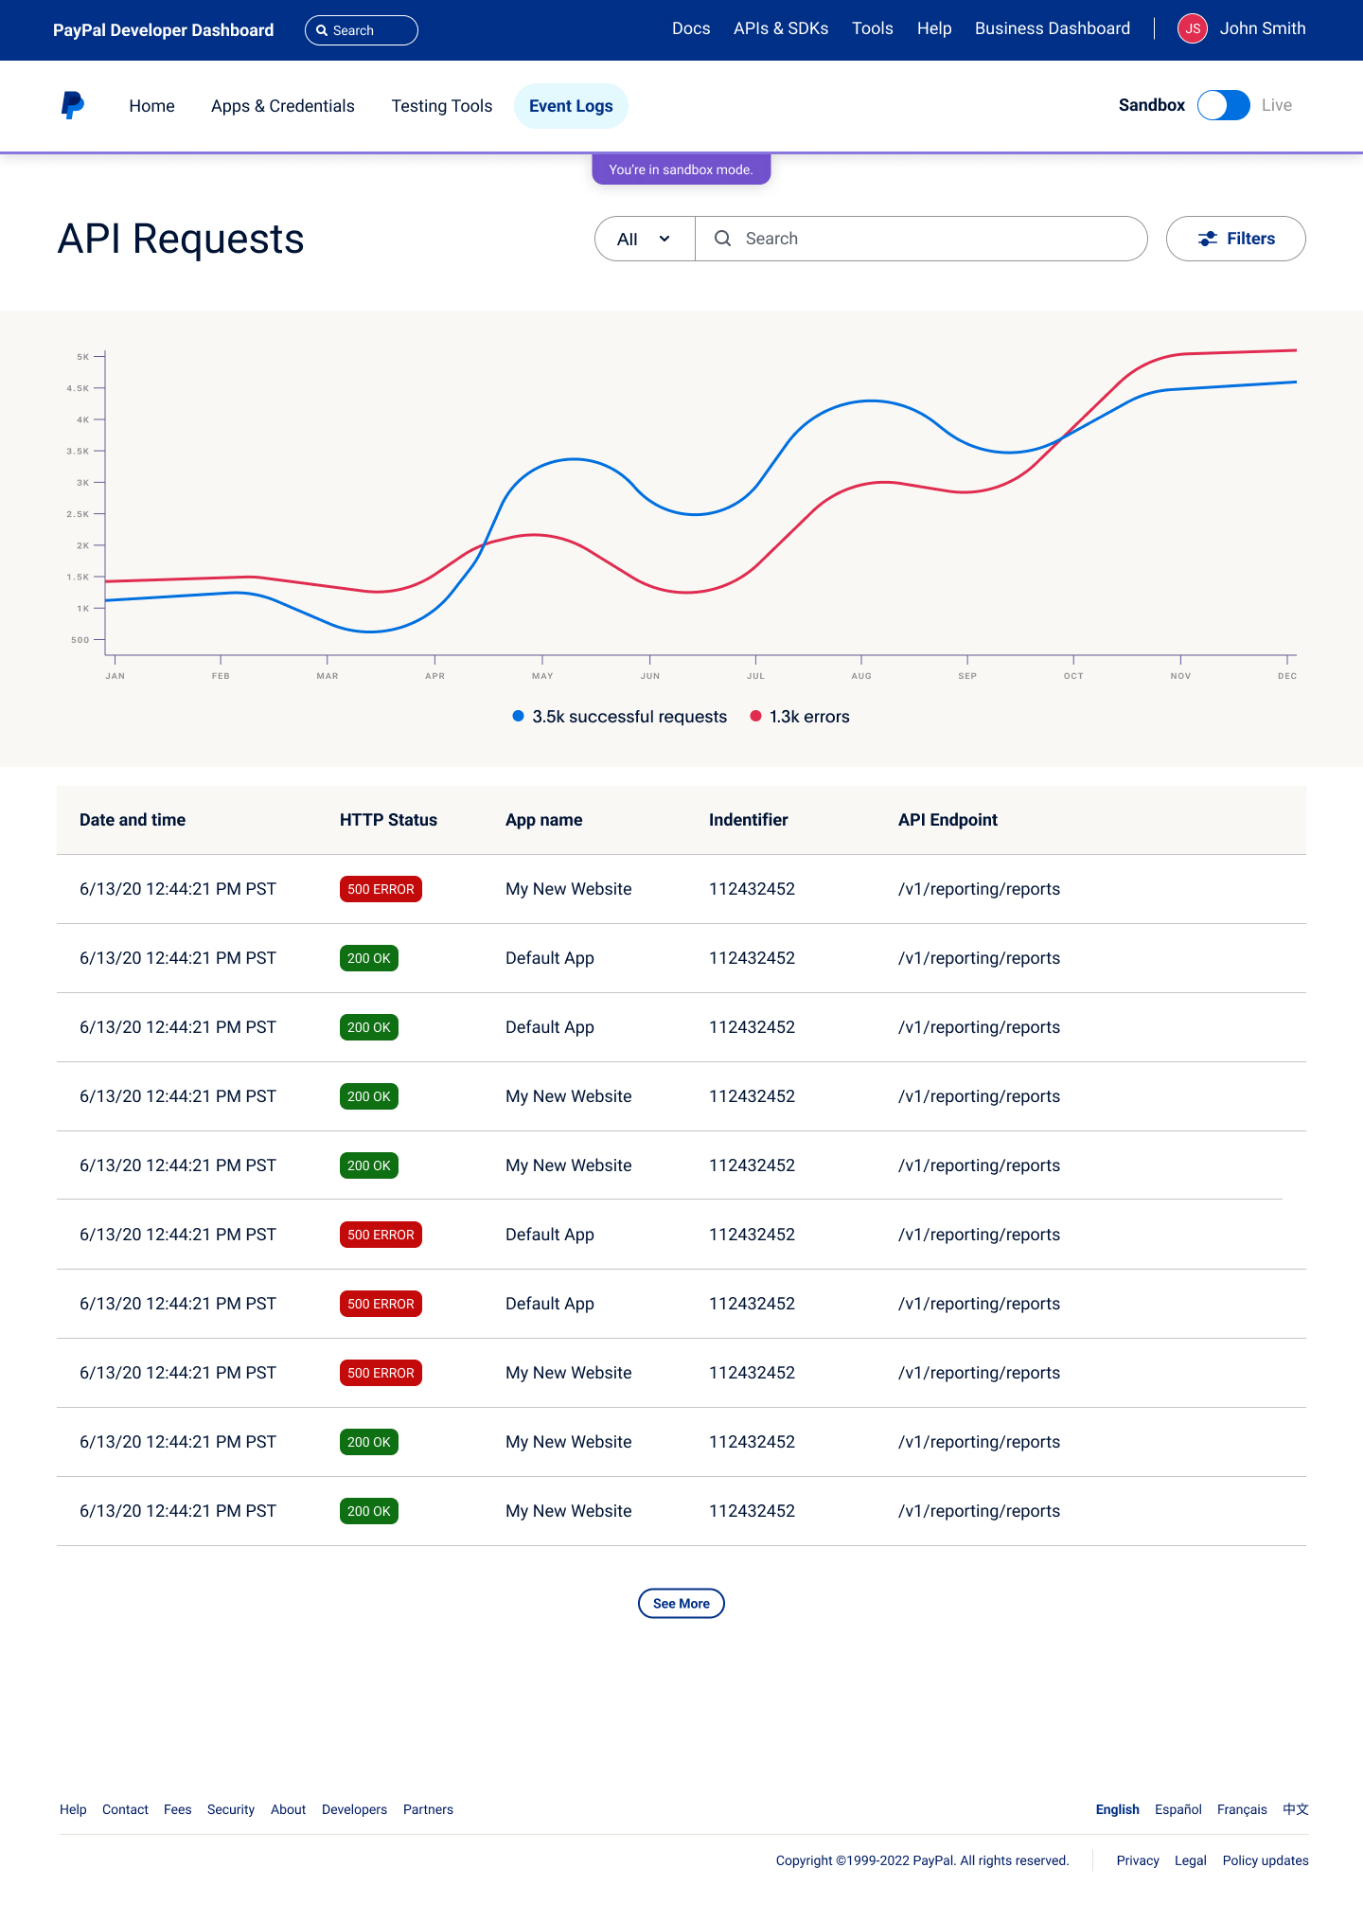
API health at a glance
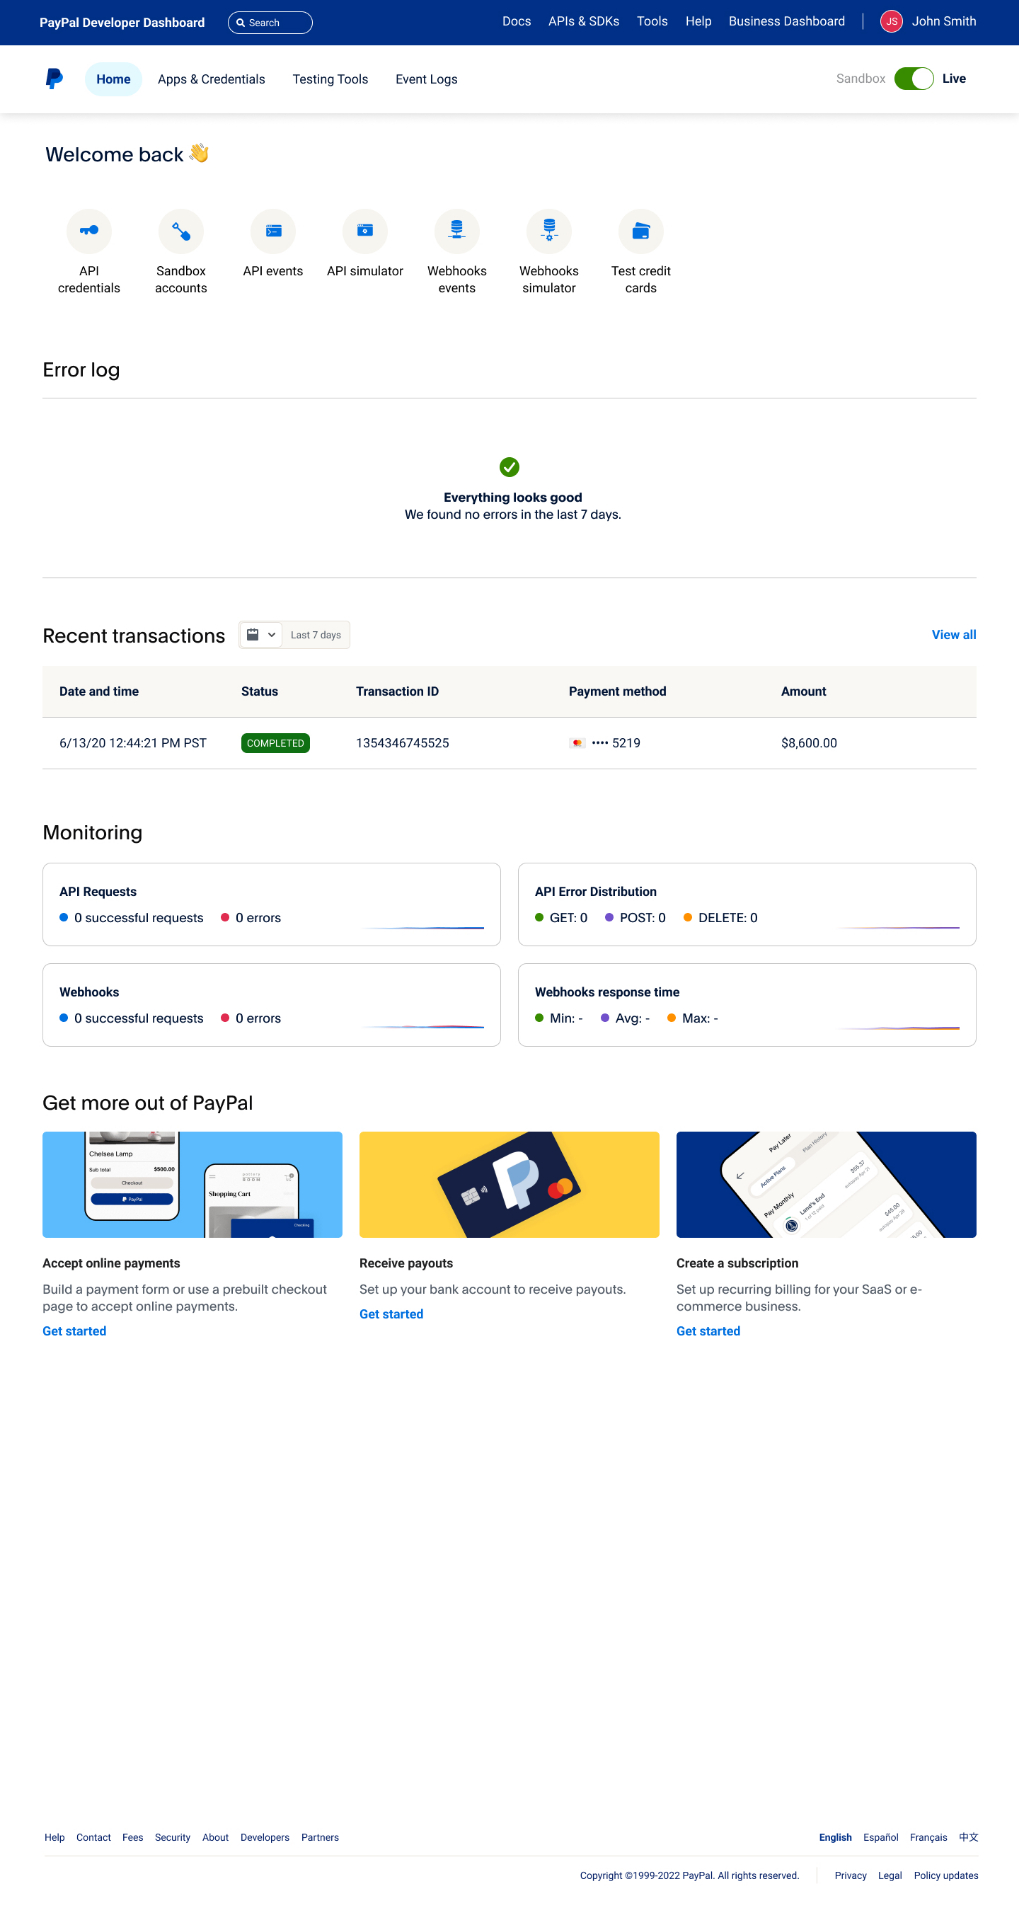
Reward the calm
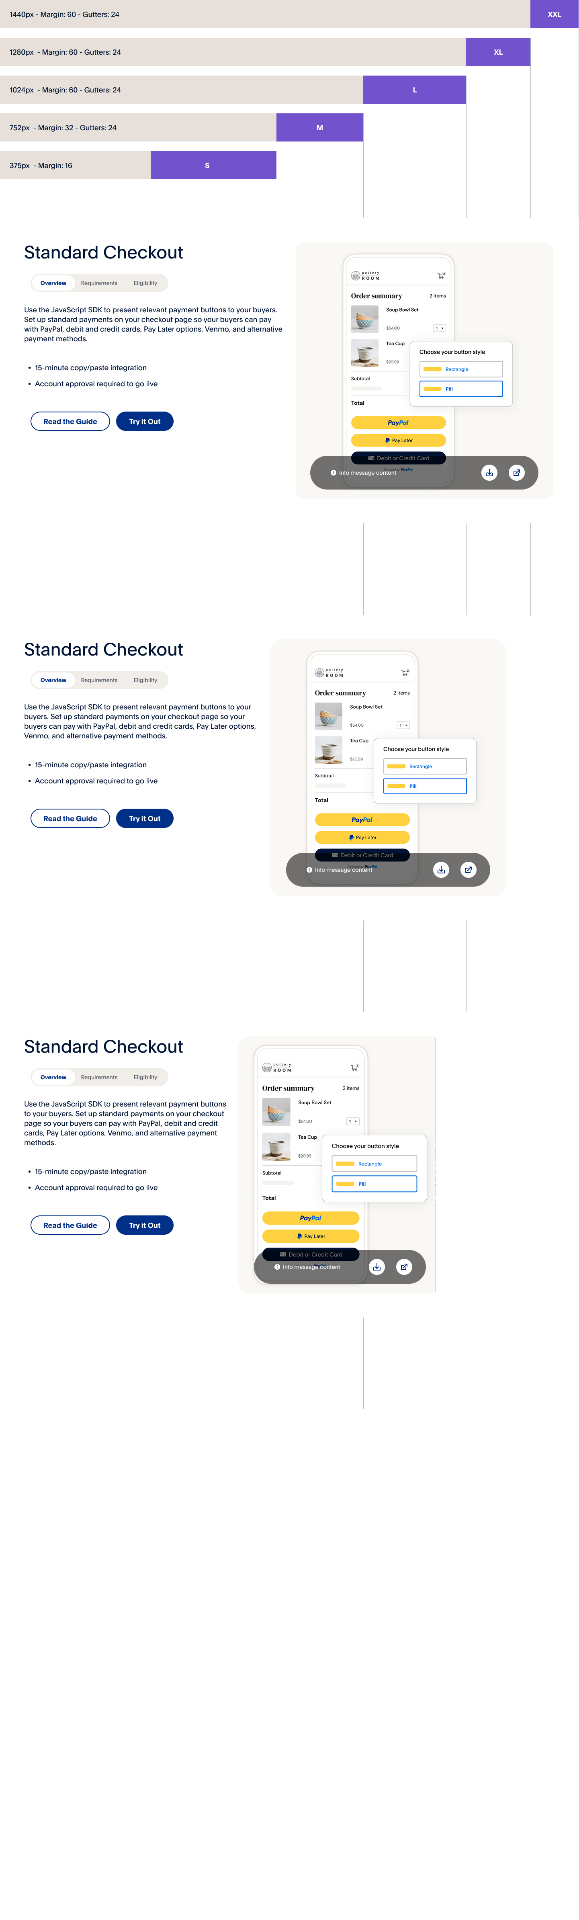
One responsive system
Gallery